PUBLIC OPINION ANALYSIS –
By Glynn Wilson –
There are three new polls out worth mentioning as we look at where the American electorate stands in 2019 after two years with President Donald J. Trump in the White House.
We know that polls are unpopular now since people think the polls got the election of 2016 wrong. But that’s not really the case. The polls were close and within the margin of error for the most part. The problem was not the polls so much as how the pundits interpreted the numbers — and how the press and media reported them.
Pundits tend to either be blatantly conservative and Republican or liberal Democrats, or play the same game as the mainstream mass media and pretend to have no bias and report the numbers objectively by being fair and balanced and reporting both sides.
I’m working on a new mathematical formula to show how all three of these models are flawed, but for today, let’s just do the social scientific analysis of the numbers in front of us.
Do Independent Voters Now Outnumber Republicans and Democrats?
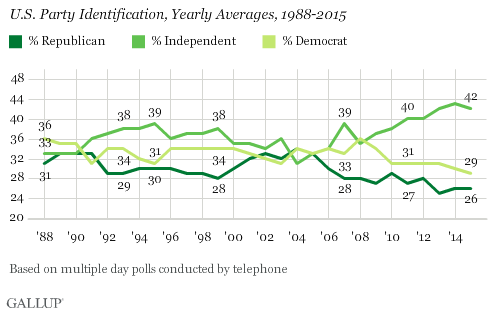
Not really. The first poll I want to talk about is a Gallup poll showing a historic high in the number of voters who identify themselves as political independents. It’s a bit sensational and misleading on the face of it, but let’s parse the numbers.
Democratic, Republican Identification Near Historical Lows
Gallup’s phone surveys are now picking up historic highs in the number of voters unwilling to self identify with either major political party.
Gallup says 42 percent of respondents now say they are independents, with 29 percent saying they are Democrats and 26 percent saying they are Republicans.
Gallup has only been asking this question since 1988, so the data is not what it could be if we had been asking this back to the 1950s, ’60s or ’70s.
Now Gallup makes a big deal out of its findings saying the percentage of voters identifying as independents did not reach 40 percent until 2011.
If I was in a position to compare this number to news content at the time, I could show how this number coincided with news coverage of the tea party movement, which got its start to protest the push for national healthcare, and the occupy movement’s protest of the federal government bailout of the big banks.
People on the political left and right both had reasons to protest the two major political parties so they didn’t want to publicly identify with either one of them.
Gallup’s analysis totally misses these points, instead obtusely blaming the phenomenon on public disgruntlement with “government gridlock.”
The Gallup story goes on and on about this, but it’s not worth looking any further at their analysis.
Even the Washington Post takes a stab at knocking down Gallup’s analysis in this case, in a story that has flaws of its own under the headline: The growing myth of the ‘independent’ voter.
What neither of these stories point out is that if you take the number of voters who lean toward voting for the Republican or Democratic parties what you find is that 45 percent of voters will tend to vote for the Democrat in a presidential election, 40 percent will vote for the Republican (which exactly matches Trump’s approval rating at the moment) and only 12 percent of voters are truly independent.
It is still true that independent voters can carry an election, and that is where the swing voters are if a politician wants to win an election. Of course they also must fire up their voter base to turn out and vote. Turnout is key.
Liberals Make Gains
In another new poll just out, Gallup says that conservative voters outnumber liberals by a margin of 35 percent to 26 percent, but the real implication of this poll is that Americans are more divided than ever and scurrying into camps on the left and right like never before. It does show that liberals are making gains, probably because of the growing discontent with Trump.
U.S. Still Leans Conservative, but Liberals Keep Recent Gains
In Gallup’s simplistic polling model and fair and balanced analysis, they find that 35 percent of Americans say they are conservatives and 35 percent say they are moderates, while only 26 percent are willing to admit they are liberals.
This really should come as no surprise, considering the way the political right and the conservative media have been bashing liberals constantly with repeated propaganda messages for the past three decades turning the word “liberal” into a bad word like Communist or Socialist.
It is also not surprising since average IQ (100) working people go along with this message and there are way more of them than there are intellectual, educated people. Surveys have consistently shown that the more education a person has, the more likely they are to be liberals. It takes smarts to be a liberal. Anybody with half a brain can be a conservative and follow the simple messages promoting Christianity, patriotic nationalism and low taxes.
That’s pretty much the Republican political agenda and has been for going on 40 years now. It has worked as a political strategy for them, much of the time. The question opinion leaders should be asking is: What has it done to the country as a practical matter? Is the government and democracy working better or worse as a result?
Gallup’s results are showing the gap favoring conservatives shrinking now. Going back to the 1992 baseline — in the early days of Rush Limbaugh attacking Bill Clinton and the New York Times as liberal — conservatives had a 19 point advantage over liberals. That gap has how shrunk to just nine points in the past two years, which coincides with Trump’s tenure in the White House.
In other words, the percentage of Americans identifying as liberal has risen from 17 percent in 1992 to 26 percent in 2019. The results also show the percentage of self identified Democrats admitting they are liberals on the upswing, for the first time surpassing 50 percent.
In 1994, nearly half of Democrats described their views as moderate and only 25 percent admitted they were liberals. The number has gradually gone up since, through the Clinton presidency, the Bush presidency and the two terms of Barack Obama in the White House.
As the same time, the percentage of Republicans calling themselves conservatives has also gone up, from 61 percent in 1994 to 73 percent today.
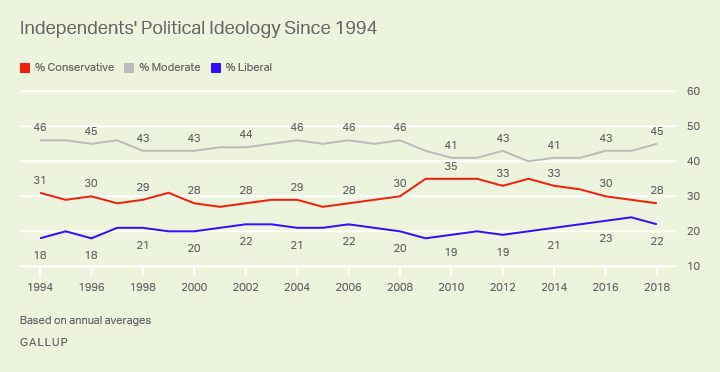
Independents tend to identify as moderates (45%), although conservatives (28%) still hold an edge here, albeit a shrinking edge, as liberal independents make up 22 percent.
“True to their non-partisan stance, the plurality of independents has consistently described their overall political views as moderate,” Gallup says. “The remainder have been more likely to identify as conservative than liberal, although conservatives’ edge with this group has been shrinking in recent years and is now just six points — it was 17 points at its widest in 2009.”
Notice this was also at the time when people were protesting the federal government bailout of the banks. The public approval rating of George W. Bush also plummeted at this time below 30 percent.
Demographic Variables
Among all major demographic and political categories of Americans, partisan affiliation has by far the strongest correlation with political ideology, according to Gallup. The gap between conservatives and liberals is widest among Republicans, with a 69-point gap in favor of conservatives. This is followed by a 38-point gap in favor of liberals among Democrats.
Other societal groups with strong conservative leanings include seniors and adults aged 50 to 64, men, residents of the South and adults with no college education. All of these groups lean conservative by more than 15 percentage points.
Race and education are factors. Whites, adults with some college education (but no degree) and residents of the Midwest lean conservative by at least 10 points.
Aside from Democrats, only two groups show strong liberal tendencies. Adults with a postgraduate education are more liberal than conservative by a margin of 15 points. Black liberals outnumber black conservatives by nine points. Young adults between the ages of 18 to 29 lean more liberal than conservative by four points. Adults between the ages of 30 to 49, women, and residents of the East lean marginally more liberal.
“Whatever the reason for its occurrence, the increased polarization of the parties presents a challenge for governing,” according to Gallup. “With a newly divided Congress, the lack of ideological overlap between Republicans and Democrats sets the stage for political impasses and zero-sum gamesmanship, rather than compromises and ‘win-win’ solutions.”
Trump’s Public Approval is Falling
As Trump is set to take to the airwaves Tuesday night to make the case that there is a crisis on the nation’s southern border and try to convince the American people that his border wall is needed, there is some indication that the government shutdown, his trade war and other policies are beginning to impact his public approval rating, even in the South.
According to a new Morning Consult poll, Trump’s net approval rating – the difference between his approval and disapproval ratings – have fallen 15 points even in Alabama since he was elected in 2016.
The poll shows that the president has gotten less popular in every state since taking office, ranging from a 36 point net decline in New Mexico to a drop of 6 points in South Dakota.
When Trump was sworn in as president in January 2017, his approval rating in Alabama was 62 percent with a disapproval rating of 26 percent, a difference of 36 points. In December 2018, the same poll methodology found Trump’s approval rating was down to 58 percent with a disapproval rating up to 37 percent, for a difference of 21 points and a decline of 15 points.
Of course Alabama is still one of Trump’s most supportive states, only falling behind Wyoming, where 64 percent still approve of Trump, and West Virginia, where 61 percent still support him. Trump’s lowest approval rating is found in Washington, D.C, at 17 percent, followed by Vermont and Massachusetts, where 33 percent disapprove of the job the president is doing.
A good question might be what are 33 percent of the American people seeing that they actually like about Trump? Let’s see, he’s white. He cut taxes. What else? Could it be that being the biggest narcissist to ever occupy the White House and lying on an hourly basis on Twitter and television is what people are looking for in a president?
If the people keep sharing the facts and we keep combatting fake news, we can turn the corner on public opinion over time.
—
You too can participate in combatting fake news with real news by making a donation today.


